# Carto.js
## Context
- no longer actively developed, but major bugs will be addressed
- uses the carto engine api (cartoDB)
- open source software based on PostGIS and PostgreSQL. It is now a software as a service cloud computing platform for GIS, web mapping and spatial data science tools.
- offers Data Ingestion, Data Enrichment, Analysis, Solutions and Visualizations as well as Integrations to help business analyze their spatial data and to find solutions.
- requires using an API key
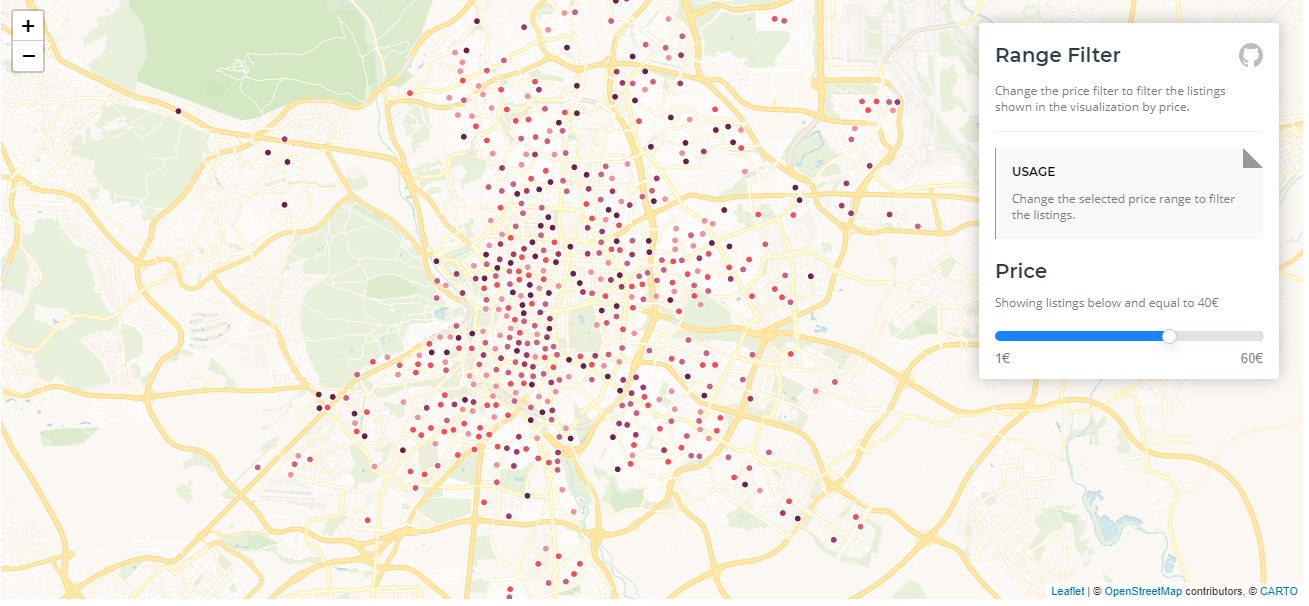
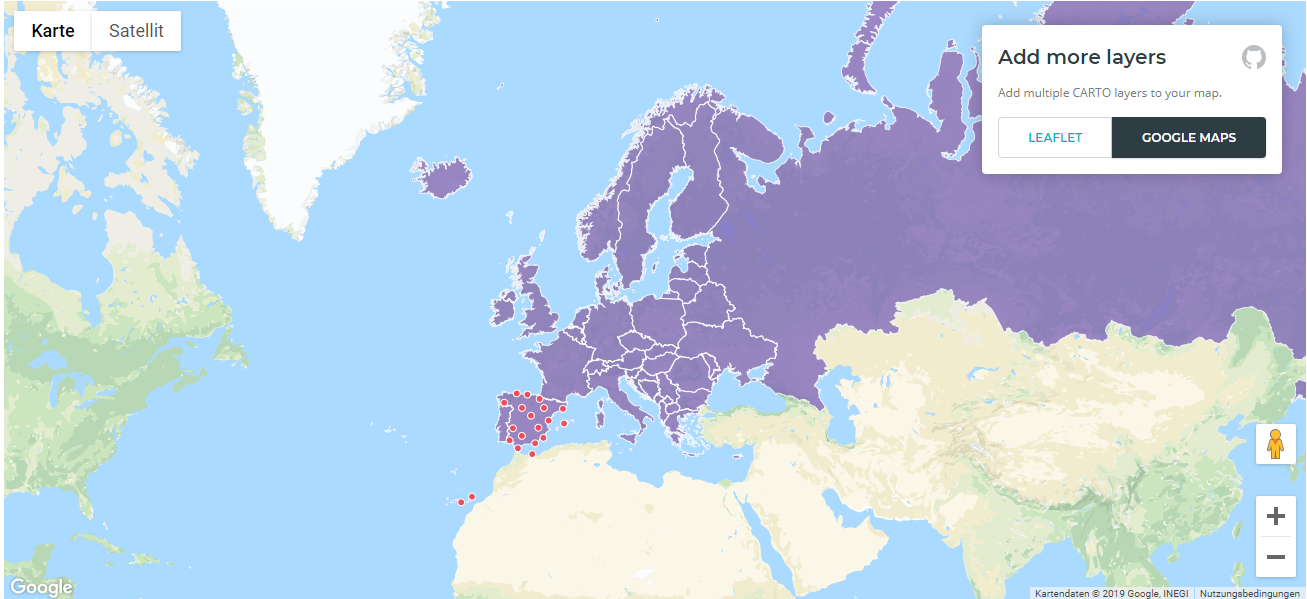
- produced visualization: a map with layers, rendered using Leaflet or Google Maps
- Developers: CARTODB.Inc
## Users
- DHL
- Vodafone
- Mastercard
- Bloomberg
- BCG
- Telefonica
## Categorisation
- what is possible:
- define different layers
- tooltips
- country selector widget
- listening to Data Changes on the Dataview
- different filters
- develop own visualisations
## Experience
- support:
- detailed documentation:
- I experimented a bit with examples and it creates the feeling of not being very intuitive. It would need a closer reading to completely understand how to create maps with this library