BP2019RH1 - Introduction, Motivation, Current Status
Wanda Baltzer, Theresa Hradilak, Lara Pfennigschmidt, Luc Prestin, Moritz Spranger, Simon Stadlinger, Leo Wendt
2019
Software Architecture Group
Hasso Plattner Institute
University of Potsdam, Germany
---
# Welcome
{width="650" style="display: block;margin-left: auto; margin-right: auto; width: 70%;"}
---
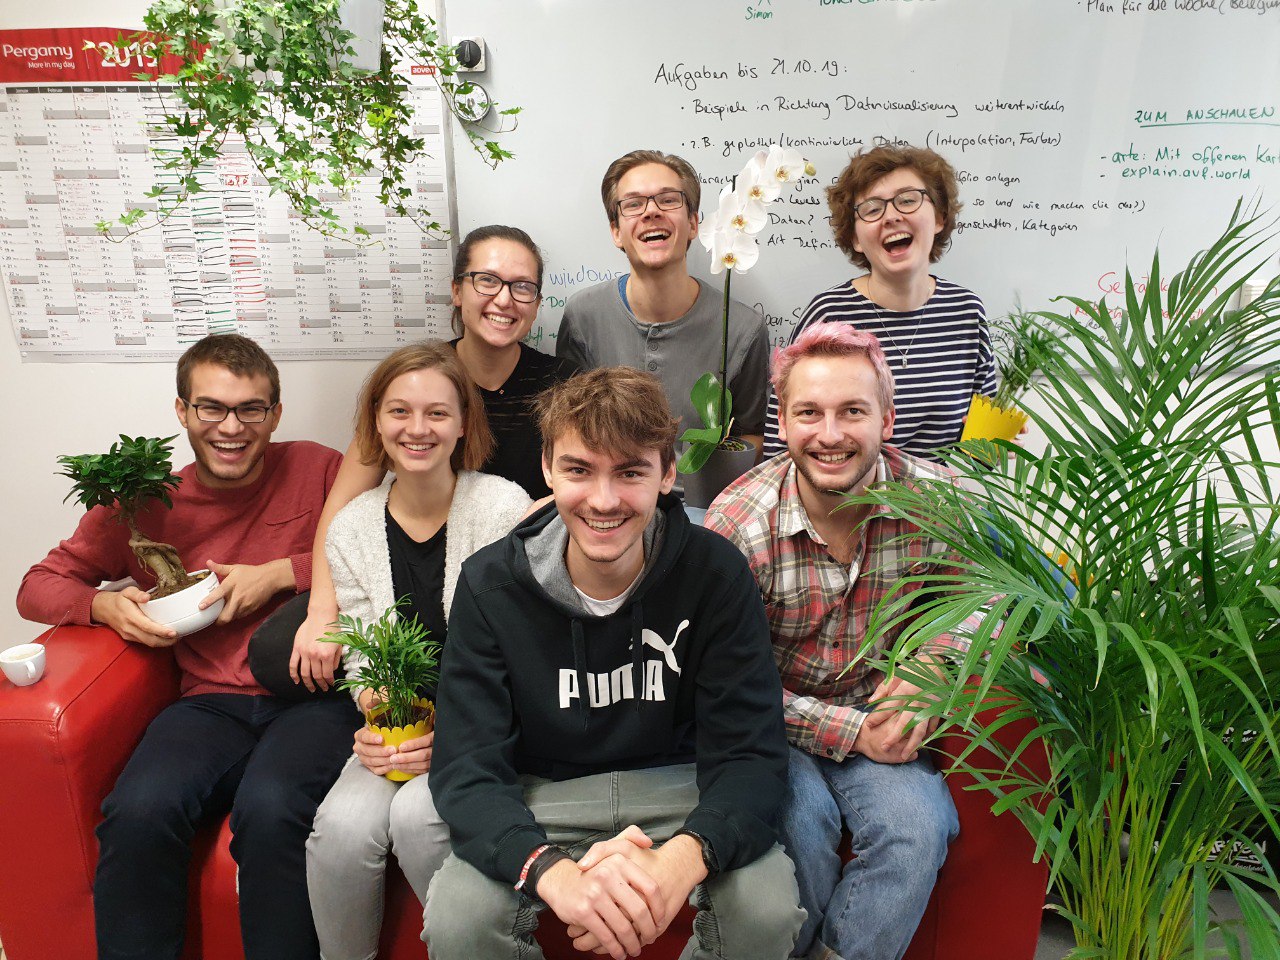
# We are
{width="850" style="display: block; margin-left: auto; margin-right: auto; width: 100%;"}
---
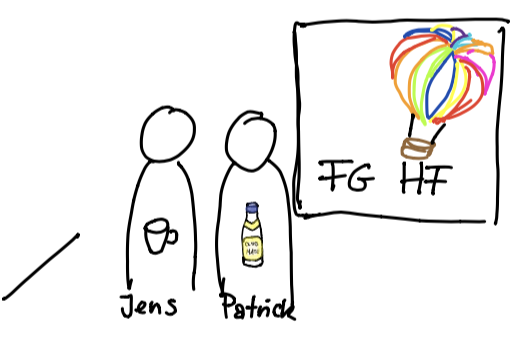
# Project Partner
{alt="drawing" width="800" height="300"}
- Cooperation with local radio stations to get meaningful insights from citizens
- People responding with SMS to questions asked on radio show
- Africa's Voices compiles, translates and aggregates responses
[More Infos](https://www.africasvoices.org/)
---
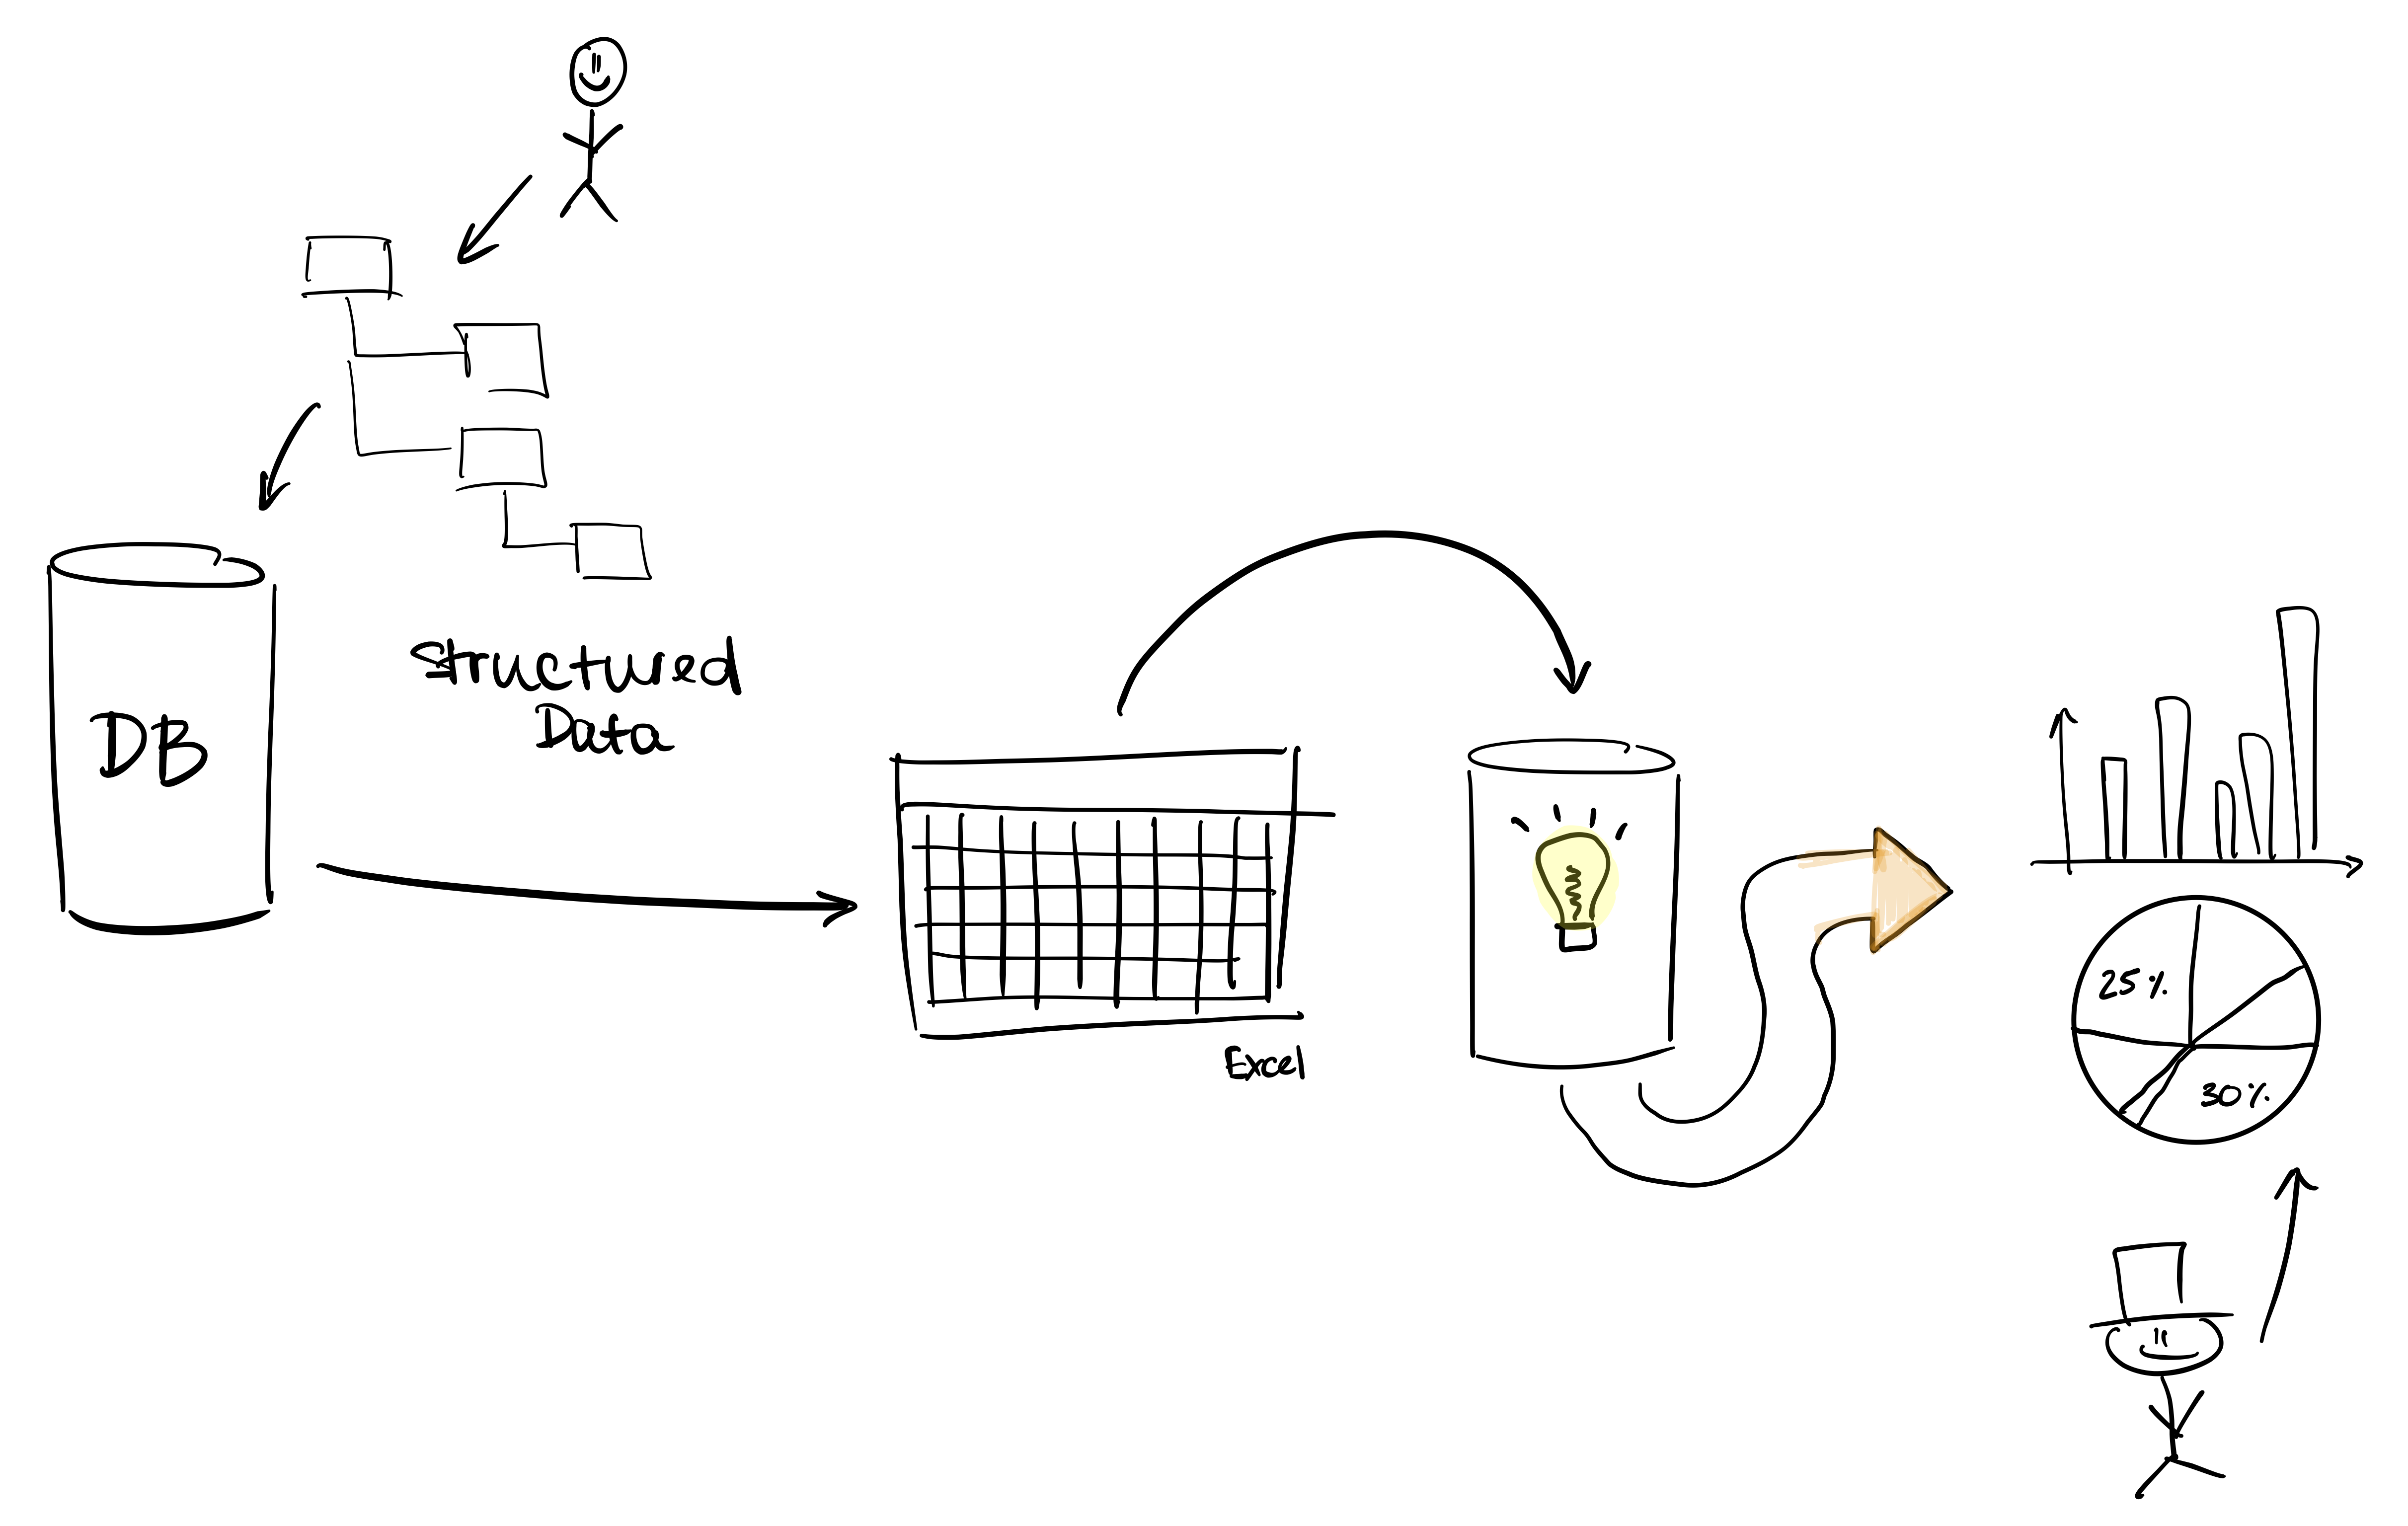
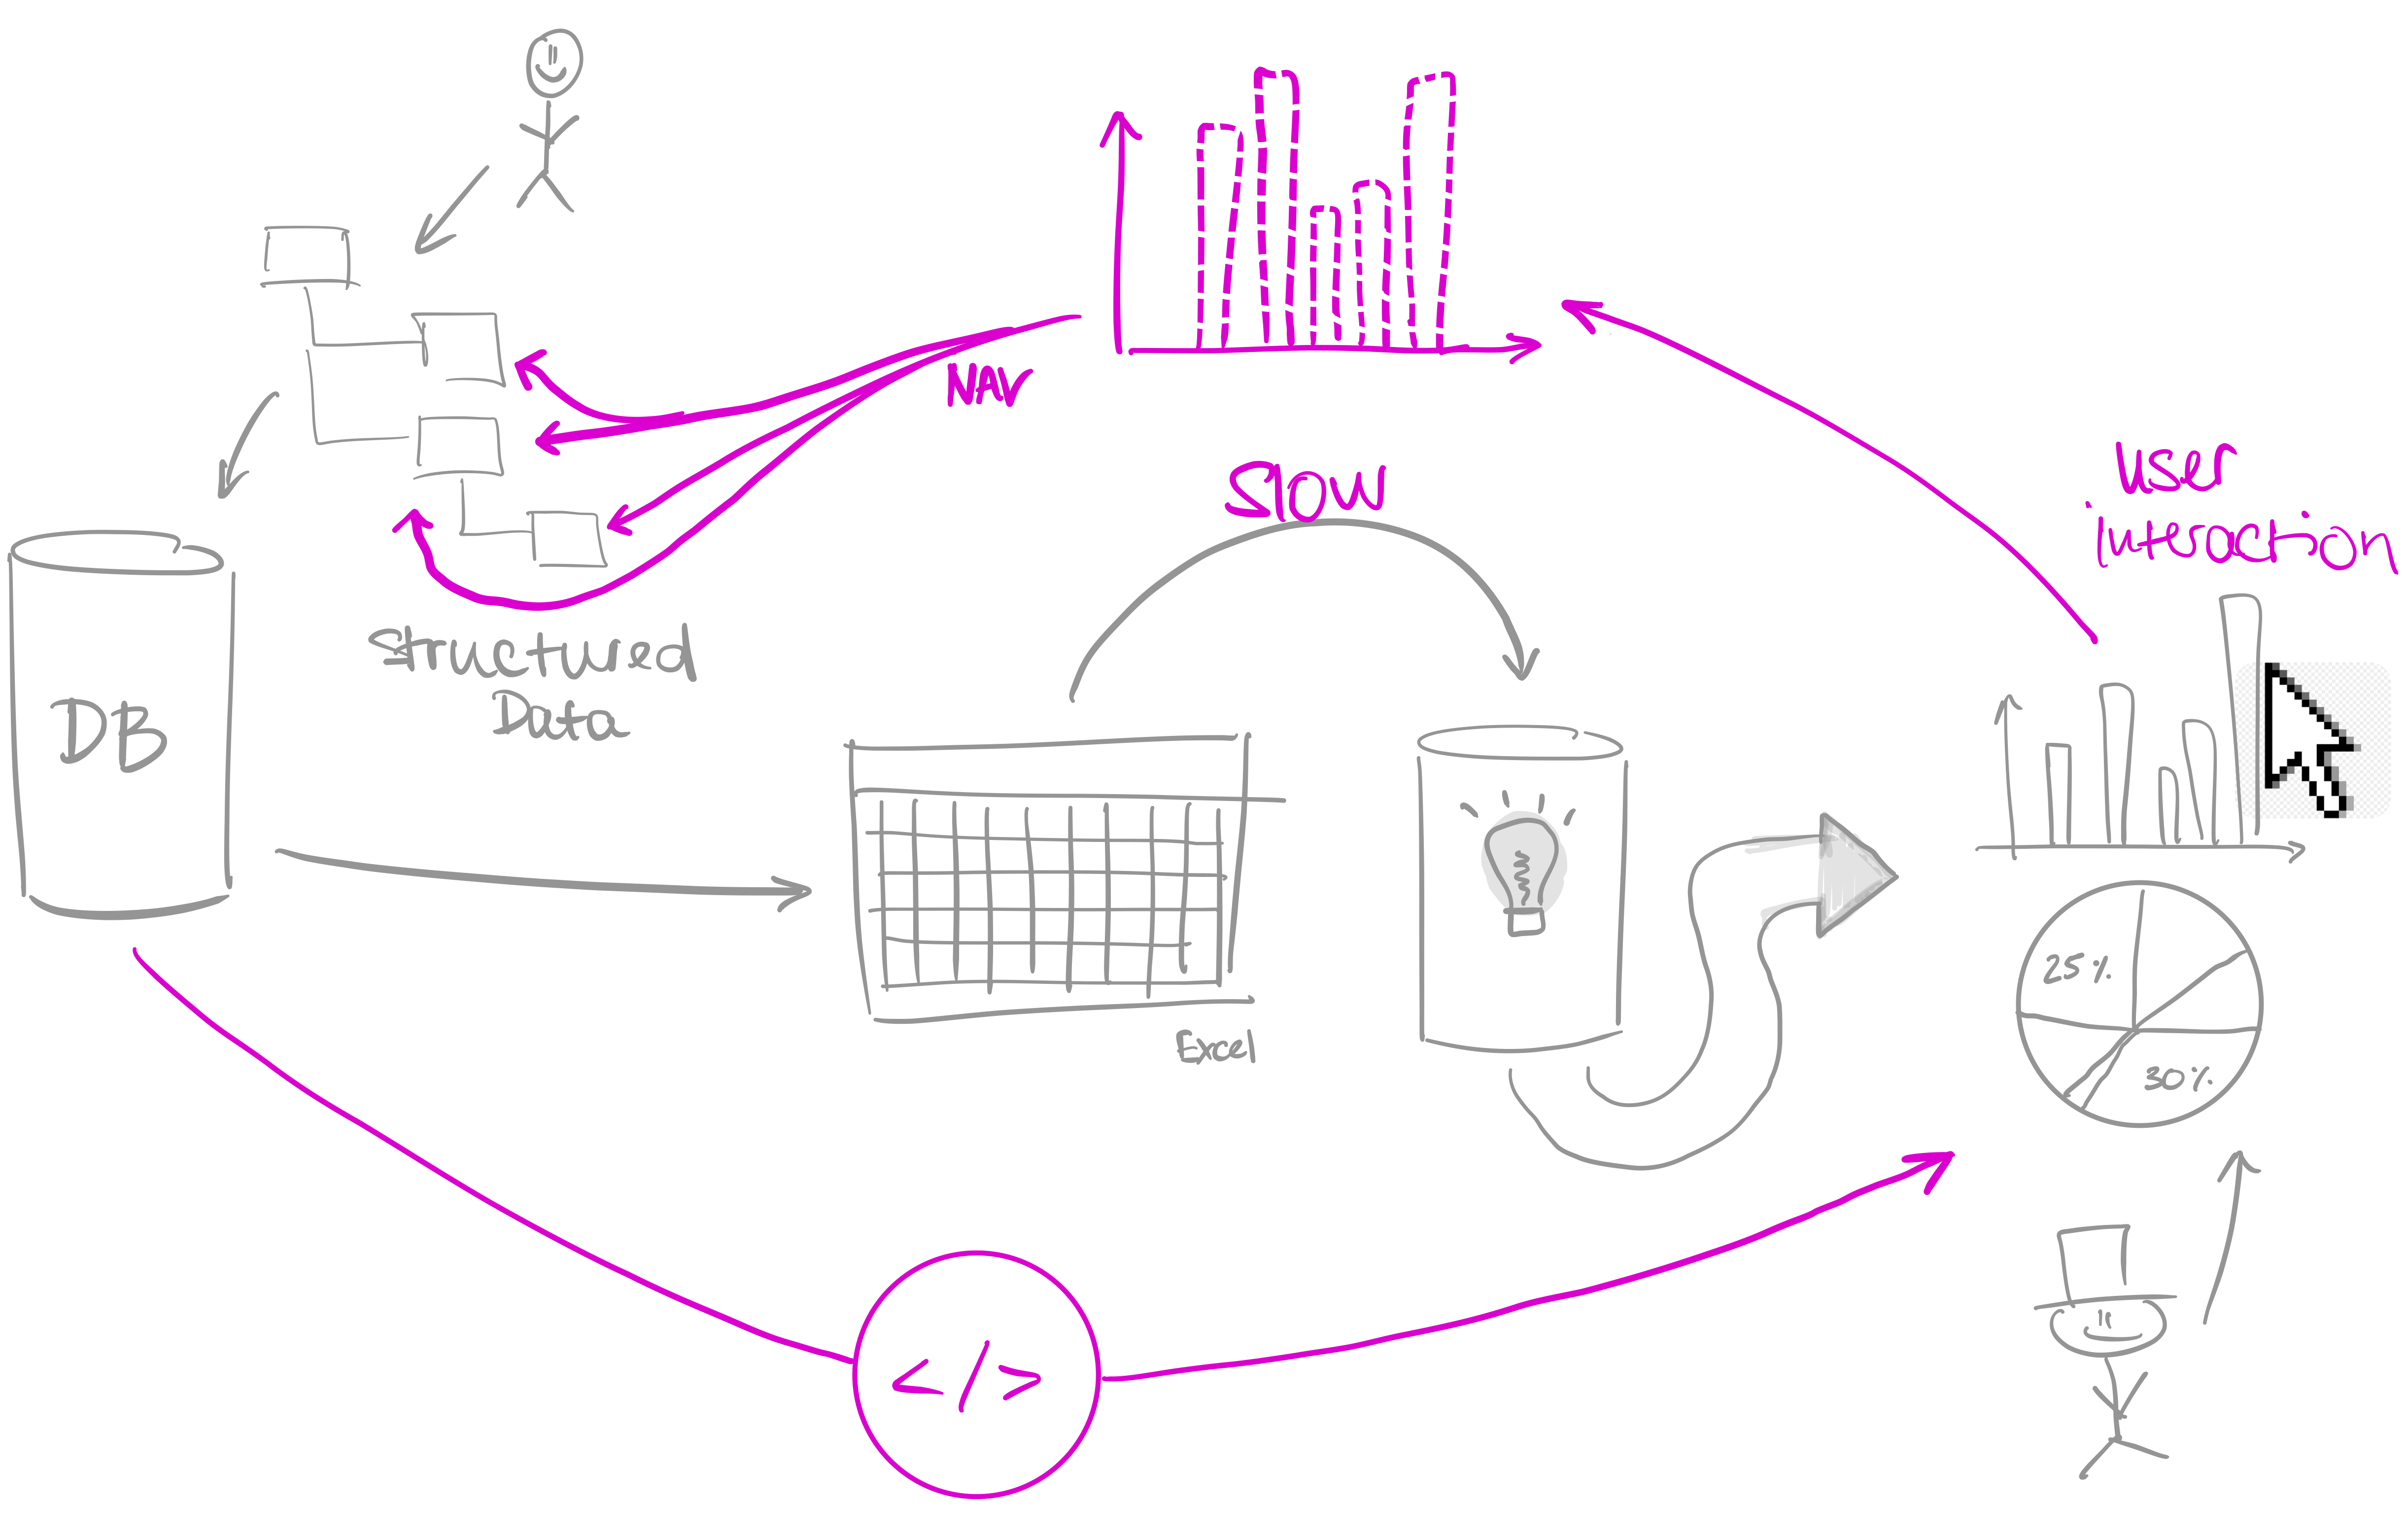
# How their current system works
{width="800" style="display: block; margin-left: auto; margin-right: auto; width: 85%;"}
---
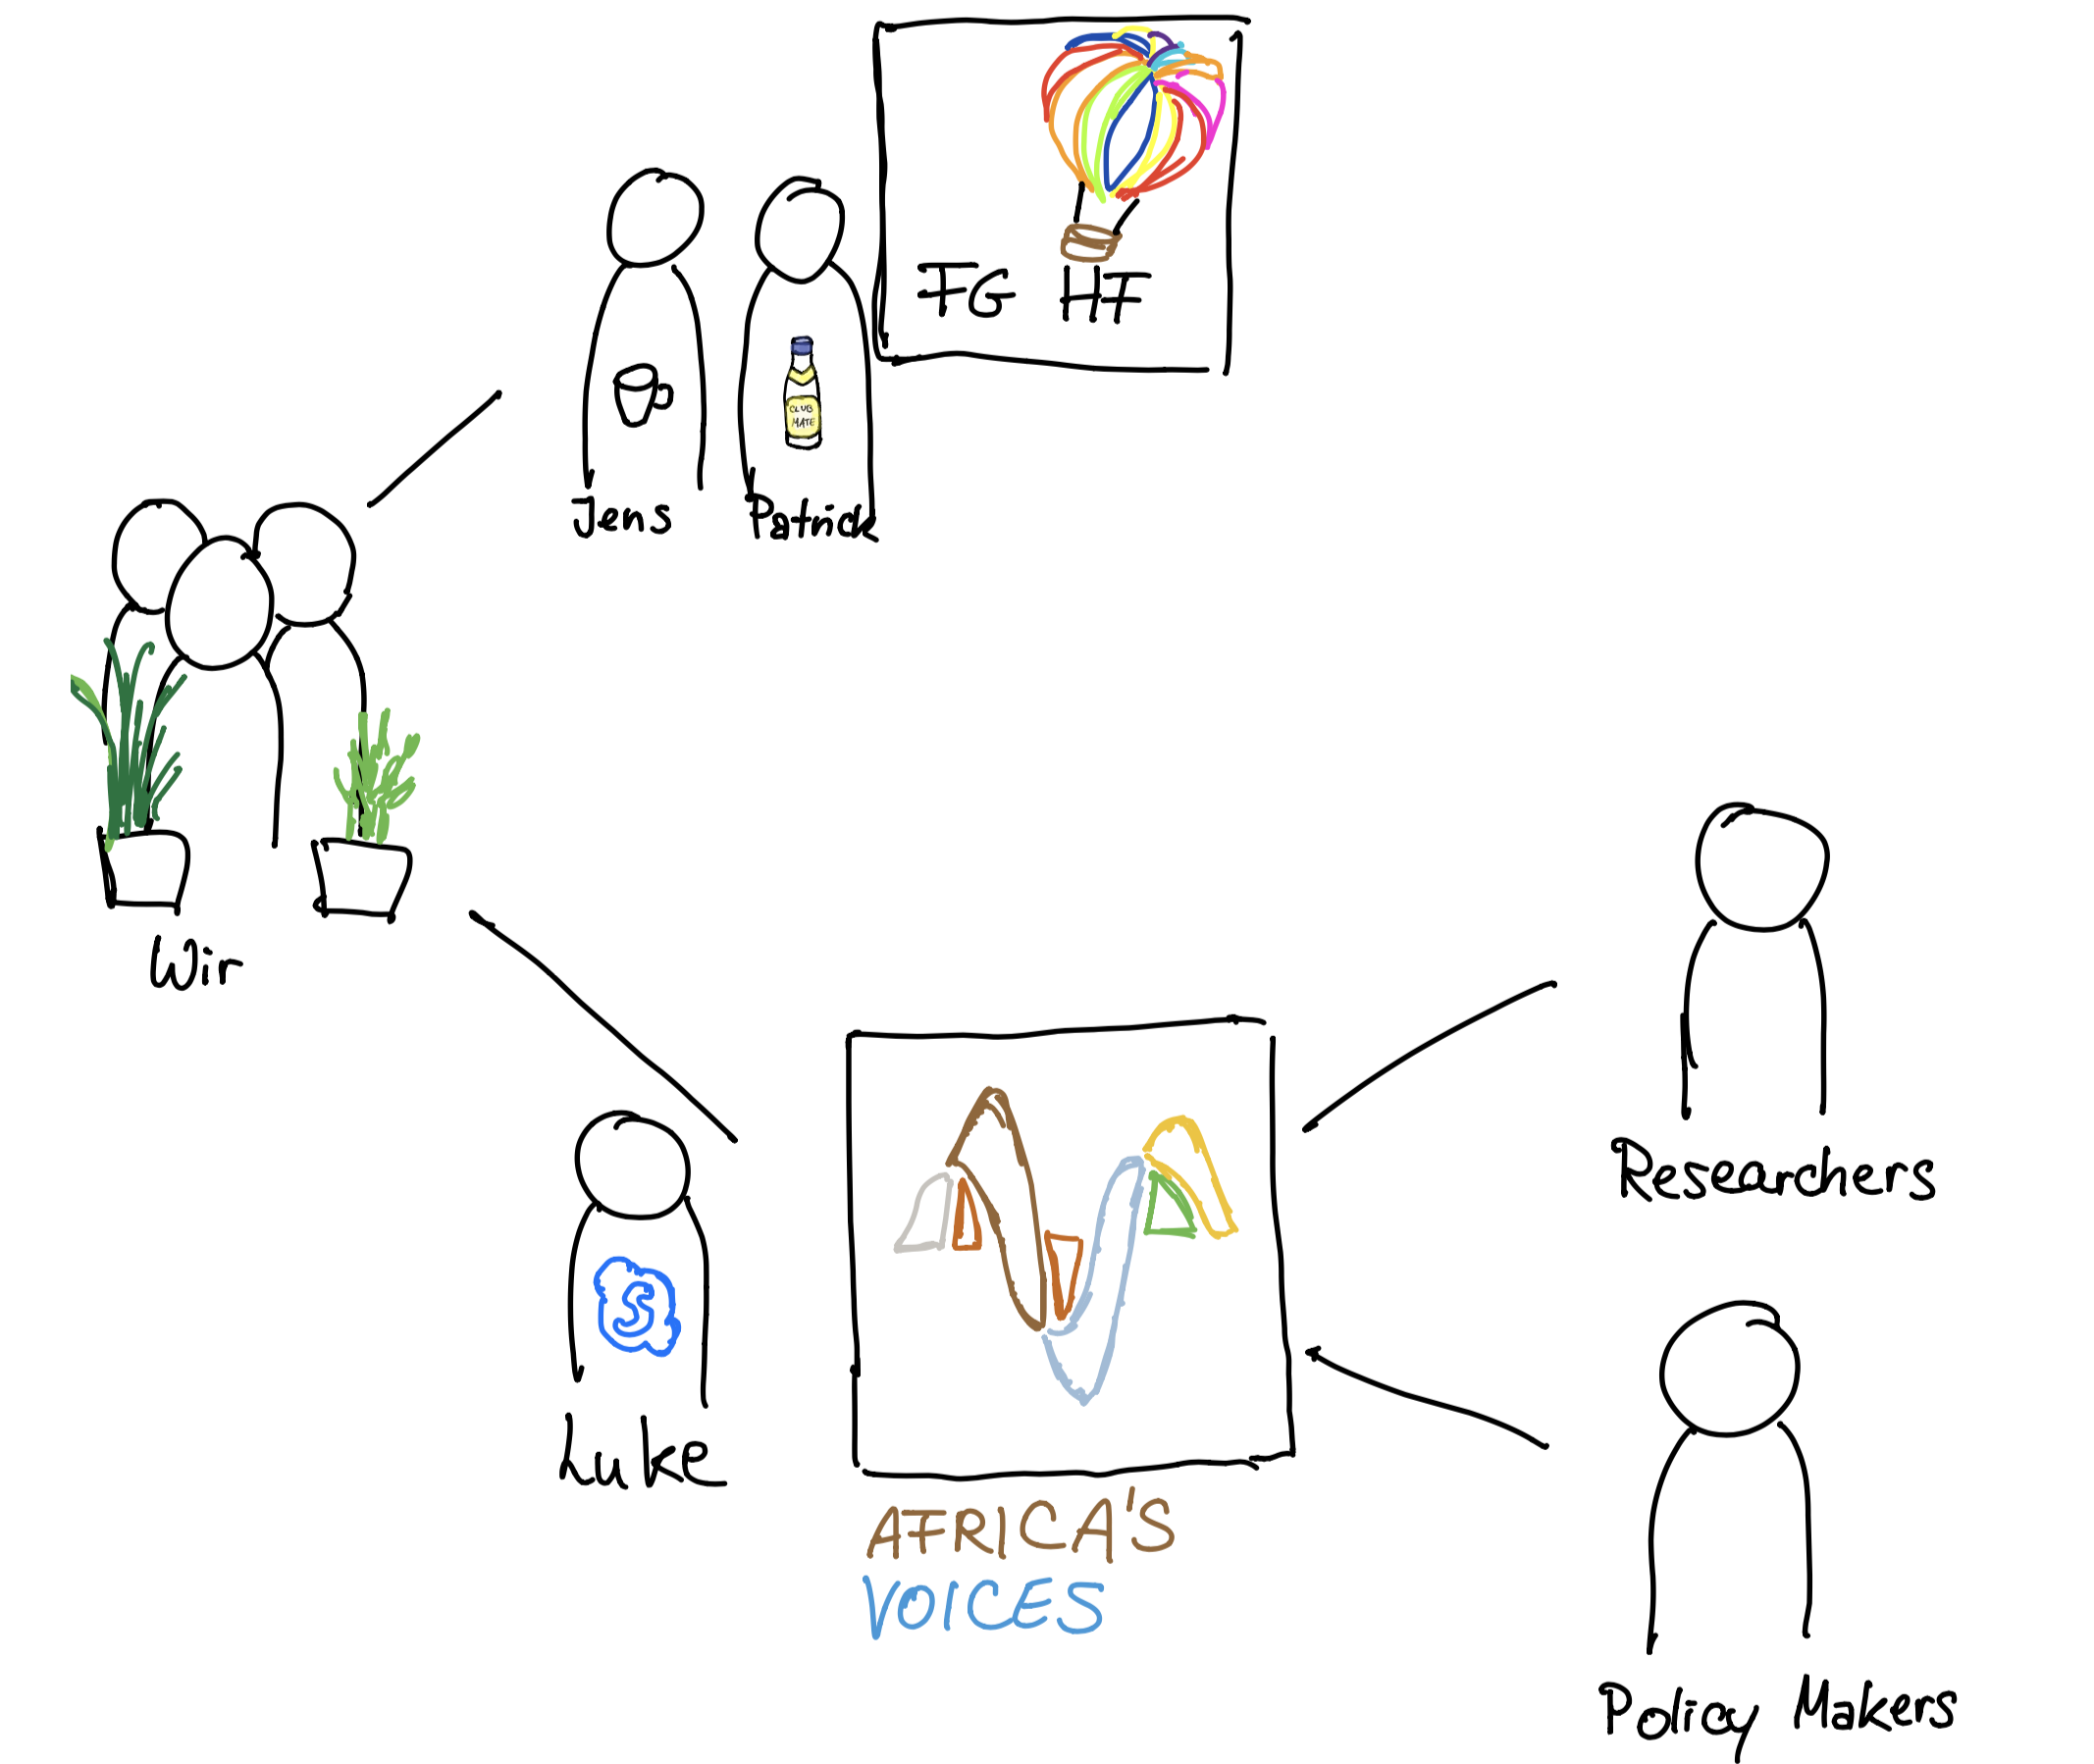
# Stakeholders
{width="700" height="500"}
---
# Stakeholders / field software architecture
{alt="drawing" width="400" height="230"}
#### Doing research
- Mapping visualization to code.
- Enable developer to trace back responsible code.
#### Doing software development
- Make the customer happy.
- Make the code reader happy.
---
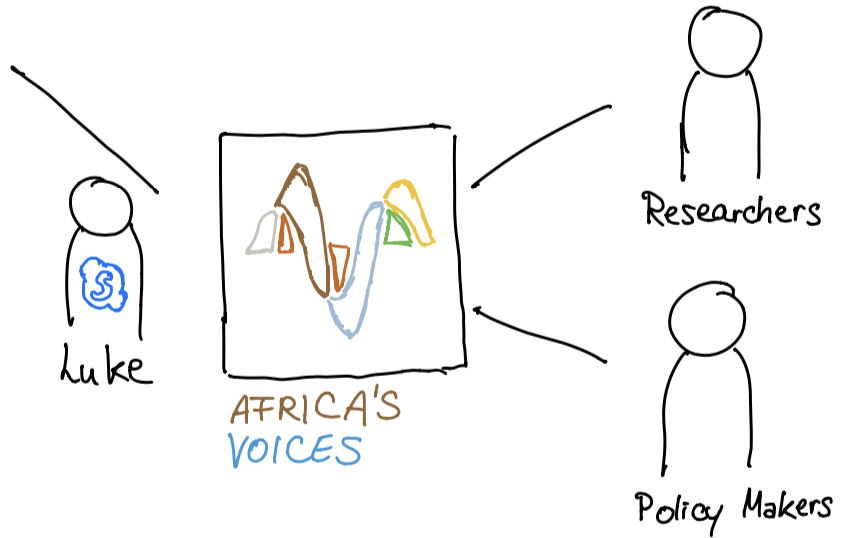
# Stakeholders / Africa's Voices
#### Researcher
Goal => Help to ease their process
1. Generate diagrams automatically.
2. Generate explorable diagrams.
3. Generate explorable diagrams to answer emerging questions.
#### Policy maker
Goal => Provide with valuable information for decision making
1. Build tool that can be used within workshops with policy makers to show data.
2. Explore together with policy maker / let policy maker explore.
3. Together with policy maker answer questions that emerge during exploration.
{alt="drawing" width="200" height="125"}
---
# Stakeholders / Africa's Voices - new system
{width="800" style="display: block; margin-left: auto; margin-right: auto; width: 85%;"}
---
# Stakeholders / we
{alt="drawing" width="100" height="150"}
#### Students
- Have fun.
- Learn new ways of writing code, using code to actually help people.
- Eventually get our bachelors degree with very good marks.
#### Why we have chosen you
- Experienced a very enjoyable atmosphere during lectures and projects done.
- Versatile and open project but also customer oriented .
- Project done well could have impact. There is a deeper meaning to it.
---
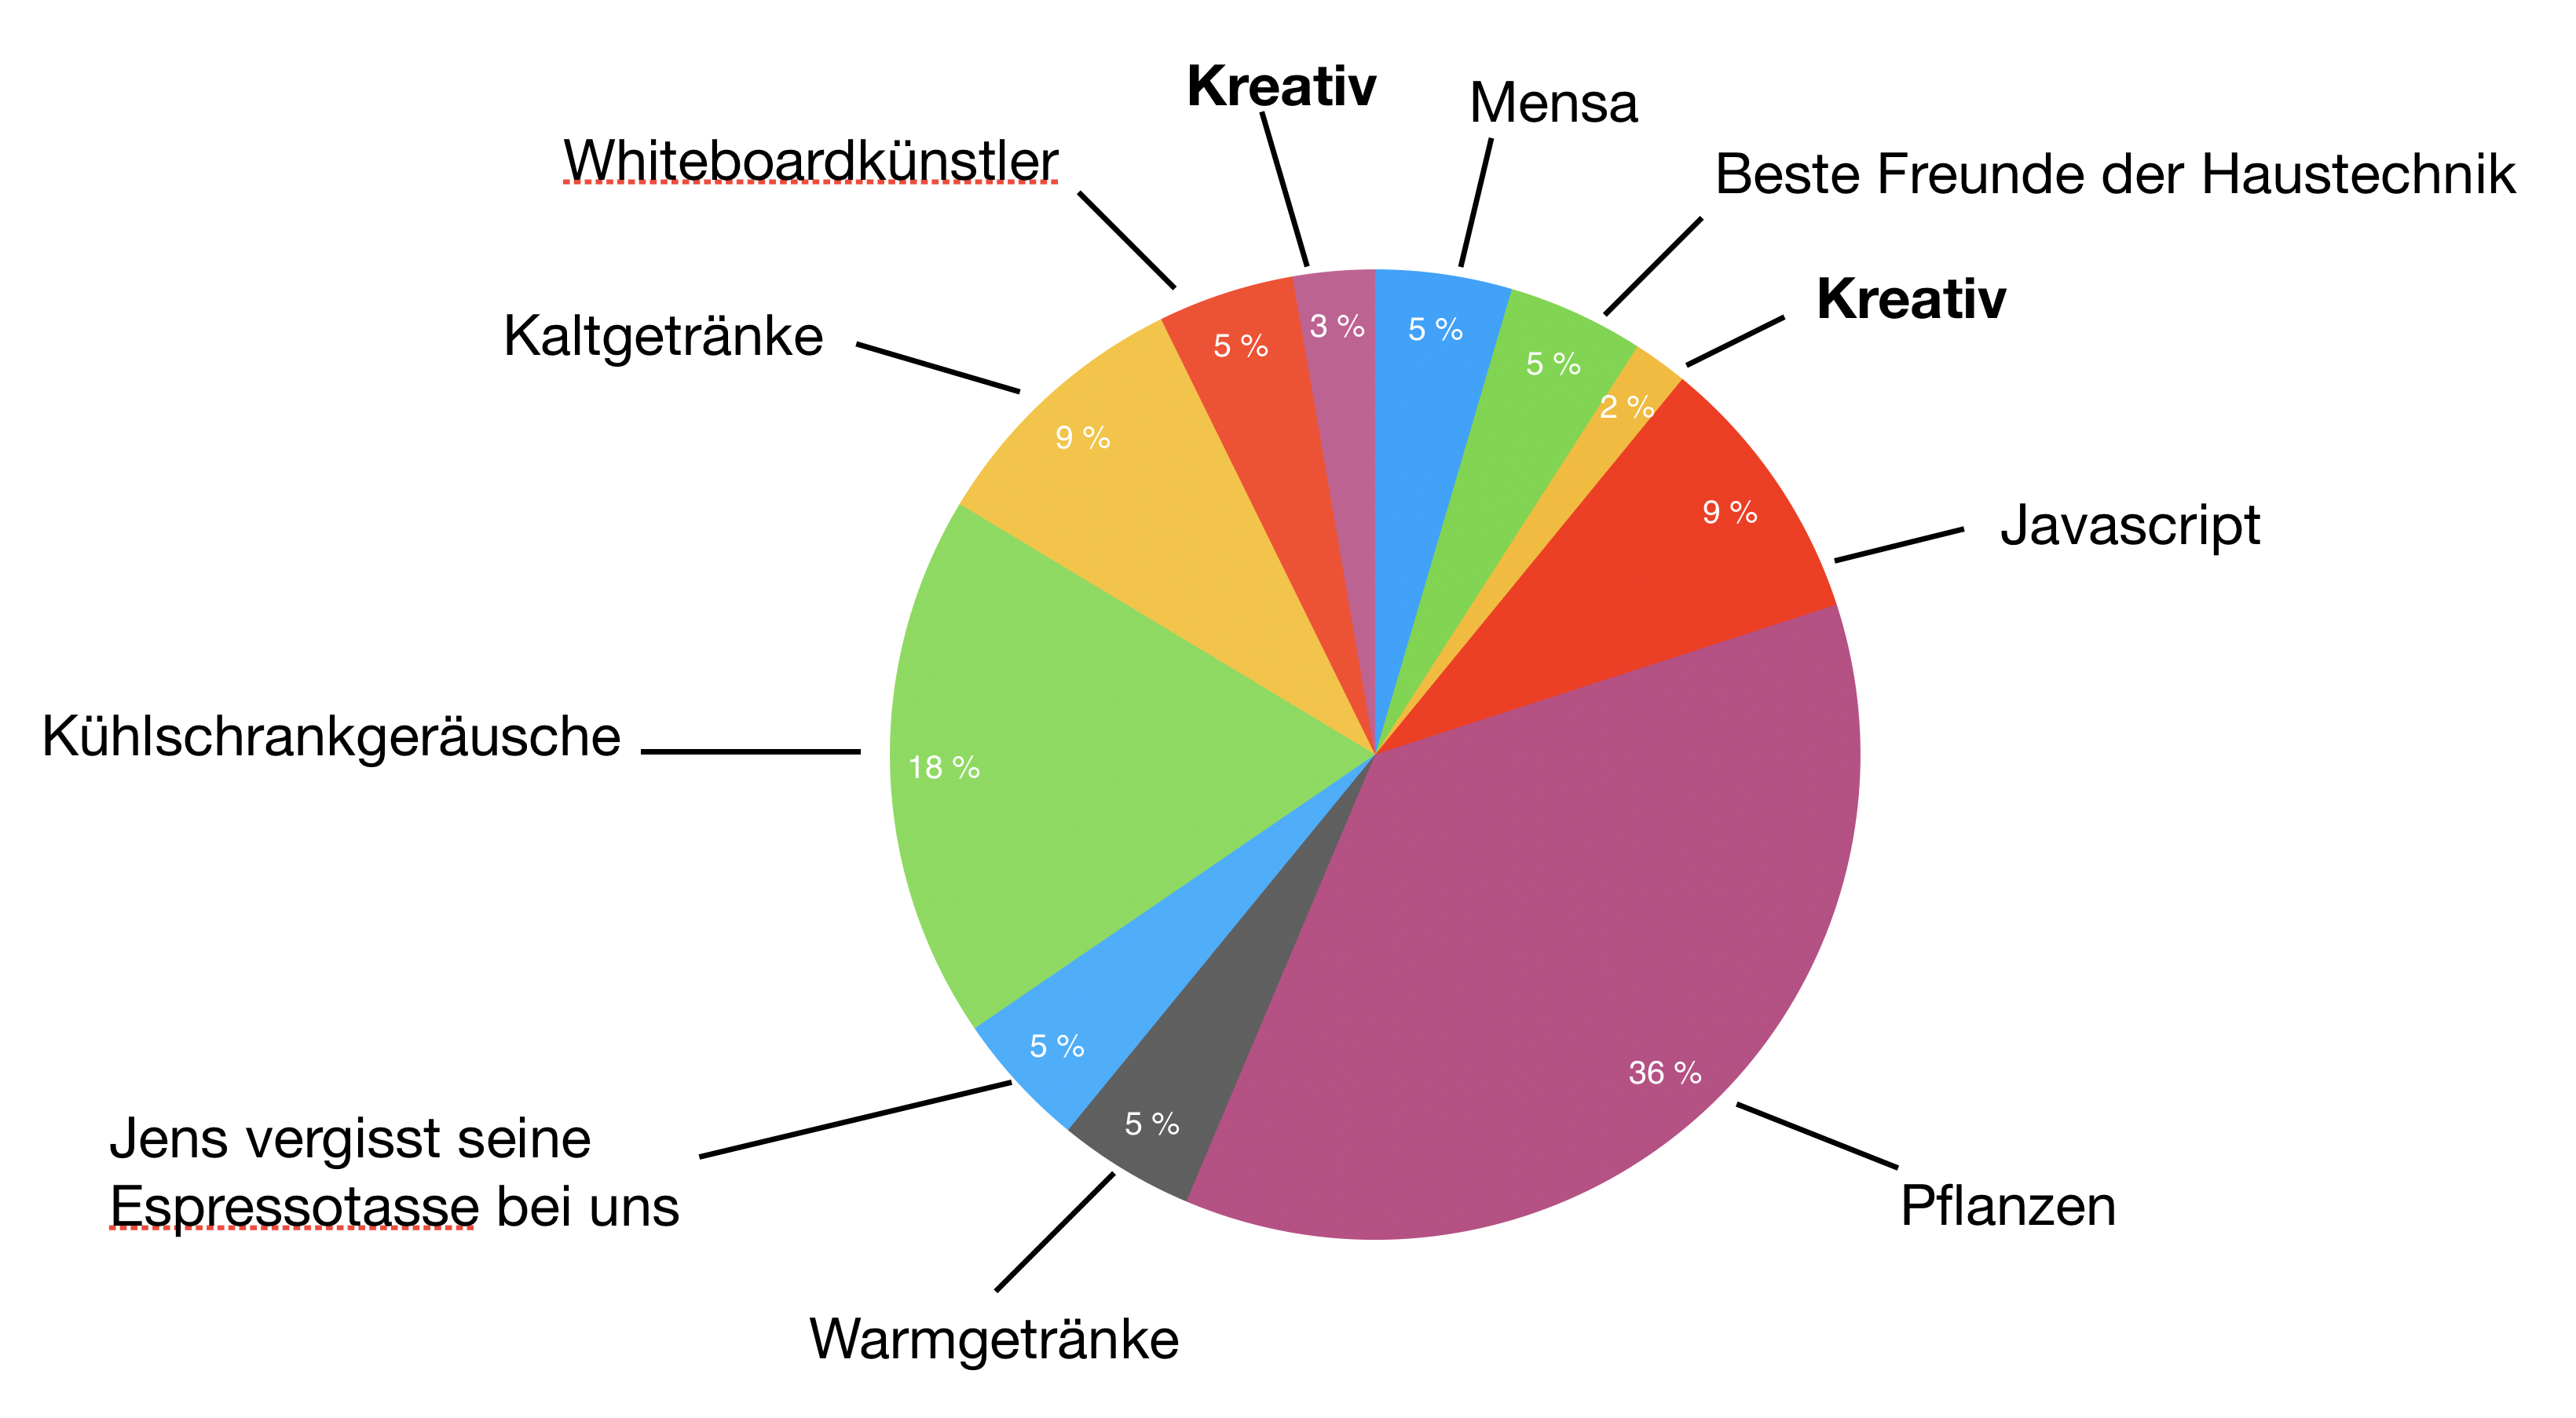
# What we've done so far
1st week: Research: How do others visualize data?
2nd week: Scratching to get familiar with Lively and JavaScript
3rd week: Research: Which libraries exists that we could use?
---
# What we've done so far - 1st week
## Research: How do others visualize data?
- How does the user experience the visualization?
- How is the data mapped to the visualization?
- How can the user interact with the visualization?
Visualizations we explored:
- [Explorable Explanations](https://explorabl.es/)
- [Gapminder](https://www.gapminder.org/)
- [New York Times interactive data visualizations](https://getdolphins.com/blog/interactive-data-visualizations-new-york-times/)
- [ObservableHQ](https://observablehq.com/)
- [Sunburn](https://typeshift.io/sunburn/)
---
# What we've done so far - 2nd week
## Scratching to get familiar with Lively and JavaScript
|
---- | ----
| 
Y Max:
|
Y Min:
|
---
# What's up next
"Und dann werfen wir Farbe ins Wasser" - Jens Lincke
### Exploring...
1. Provenance of aggregated data -> qualitative data
2. Provenance of visualization -> code
### Next week
1. Experimenting with frameworks focusing on visualization provenance
2. Which specific diagrams does our partner need?
3. Experimenting with diagrams
4. Brainstorming for user interactions
---
# What we've done so far - 3rd week
## Research: Which libraries exists that we could use?
- License?
- Use case?
- Special features?
- Customizable?
[Libraries we looked at](browse://../BP2019RH1/doc/research-libraries/index.md)
[ChartJS](browse://../BP2019RH1/doc/research-libraries/chartJS.md) -> Fancy animations
[D3](browse://../BP2019RH1/doc/research-libraries/d3js.md) -> easy user interaction
[Raphael](browse://../BP2019RH1/doc/research-libraries/raphaelJS.md) -> reproduced zooming interaction
---
# See ya :-)
{width="650" style="display: block; margin-left: auto;margin-right: auto;width: 70%;" }