BP2019RH1 - Project Partner Visit
Wanda Baltzer, Theresa Hradilak, Lara Pfennigschmidt, Luc Prestin, Moritz Spranger, Simon Stadlinger, Leo Wendt
2019
Software Architecture Group
Hasso Plattner Institute
University of Potsdam, Germany
---
# Welcome back
{width="650" style="display: block;margin-left: auto; margin-right: auto; width: 70%;"}
---
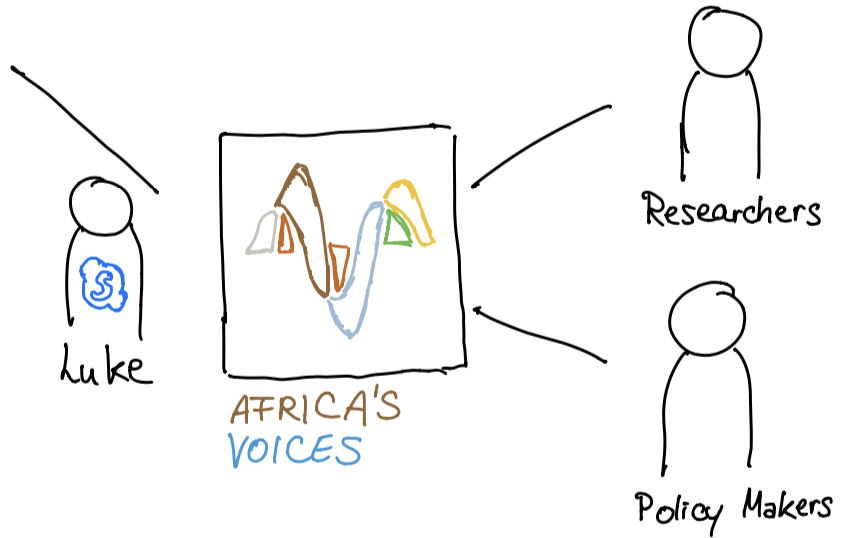
# What is our project about again?
- Get **public opinion** polls where getting representative data from citizens is hard
- People responding with SMS to questions asked on radio show
- Africa's Voices:
- compiles, translates and aggregates responses
- uses that data to **inform policy makers**
- And we?
- **generate visualizations** that can help understand and
**explore** the obtained qualitative data
---
# We had a visit
- Week before last week Luke (our project partner) visited the Fachgebiet
 ---
# What we thought our goals were going to be
### Africa's Voices Researcher
Goal => Help to ease their process
1. Generate diagrams automatically.
2. Generate explorable diagrams.
3. Generate explorable diagrams to answer emerging questions.
### Africa's Voices Policy maker
Goal => Provide valuable information for decision making
{ style="float:right" alt="drawing" width="280"}
1. Build a tool to show data to policy makers.
2. Explore with policy maker / let policy maker explore.
3. Answer questions that emerge during exploration.
---
# What we think our goals are going to be now
0. **Understand** provided data / domain
1. **Brainstorm** / Design visualizations (a lot of them)
- Unconventional
- Explorable
- Individual-centered
- No completeness of data
2. **Implement** the best ideas
(3. Synthesize similarities into a framework)
---
# We have data
- Data privacy agreement
- Two files in JSON format
- Messages (1.2 GB)
- Individuals (1 GB)
- Each line in data files represents an individual/message => provenance
- Nested structure to show merge with other tracedata
- Objects contain:
- raw data (responses and personal information)
- coding of responses
- processing metadata
---
# We are working on workflows
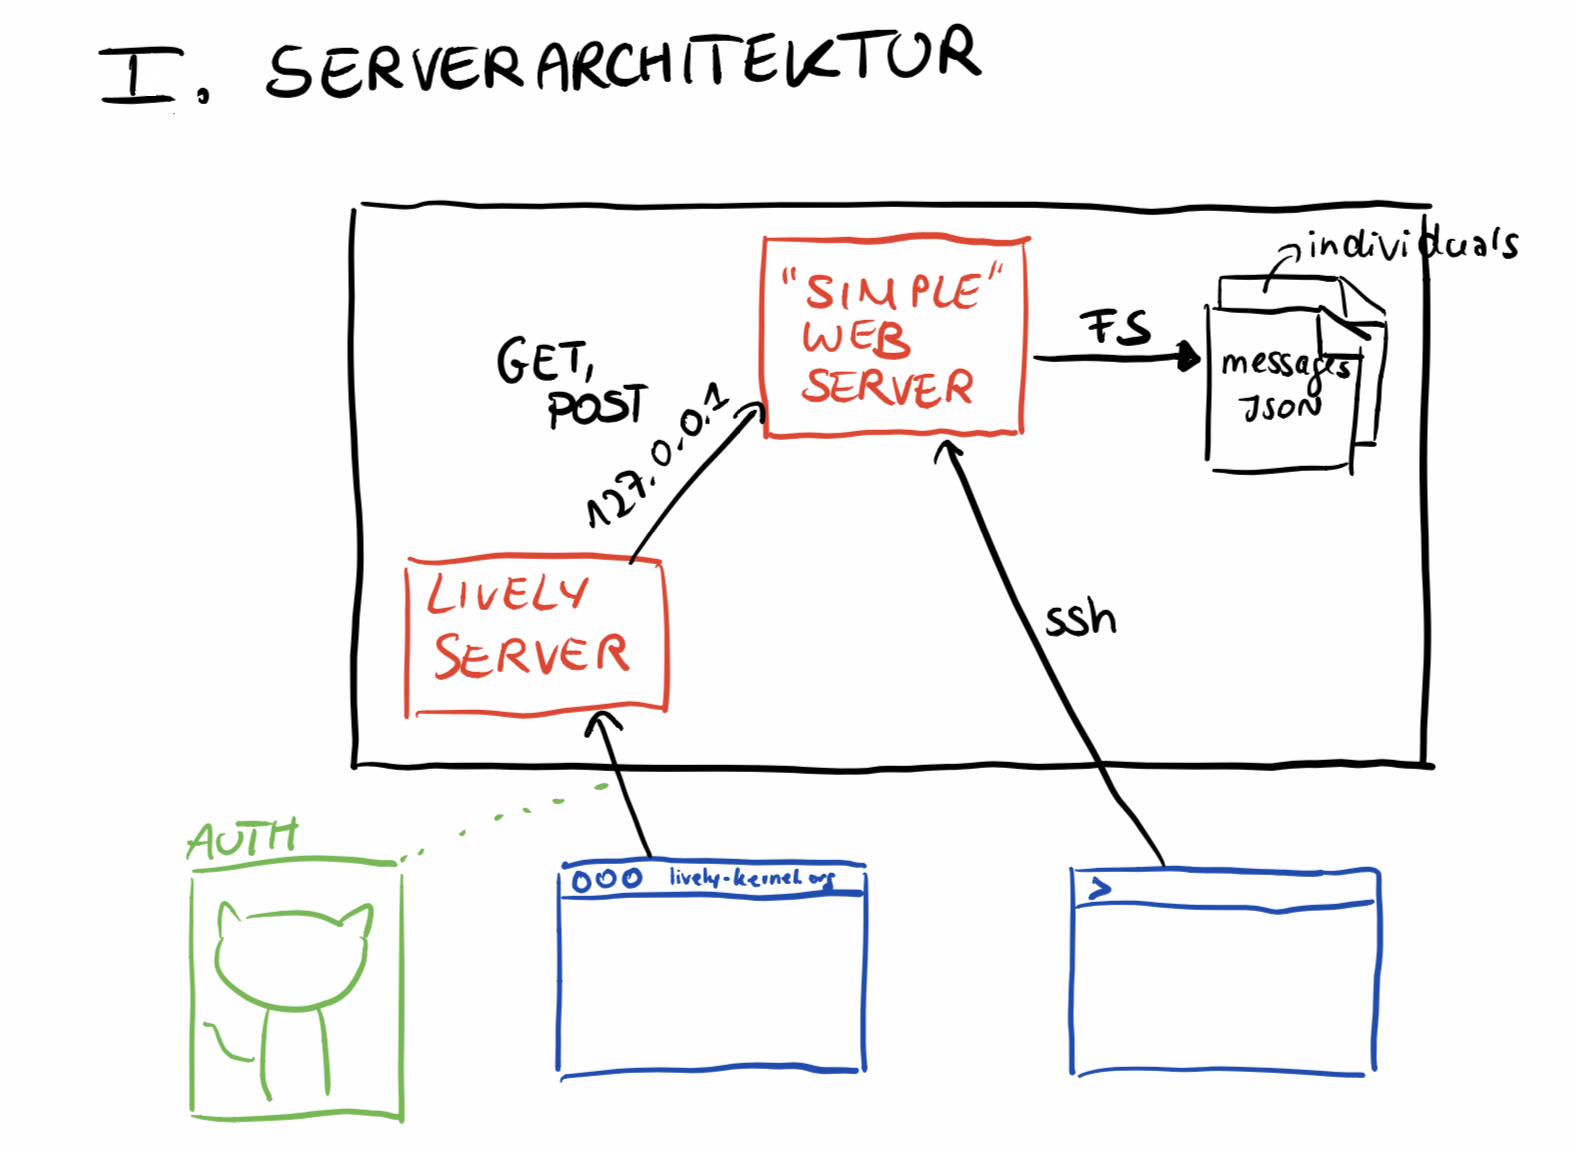{style="display: block;margin-left: auto; margin-right: auto; width: 75%;"}
---
# We are working on workflows
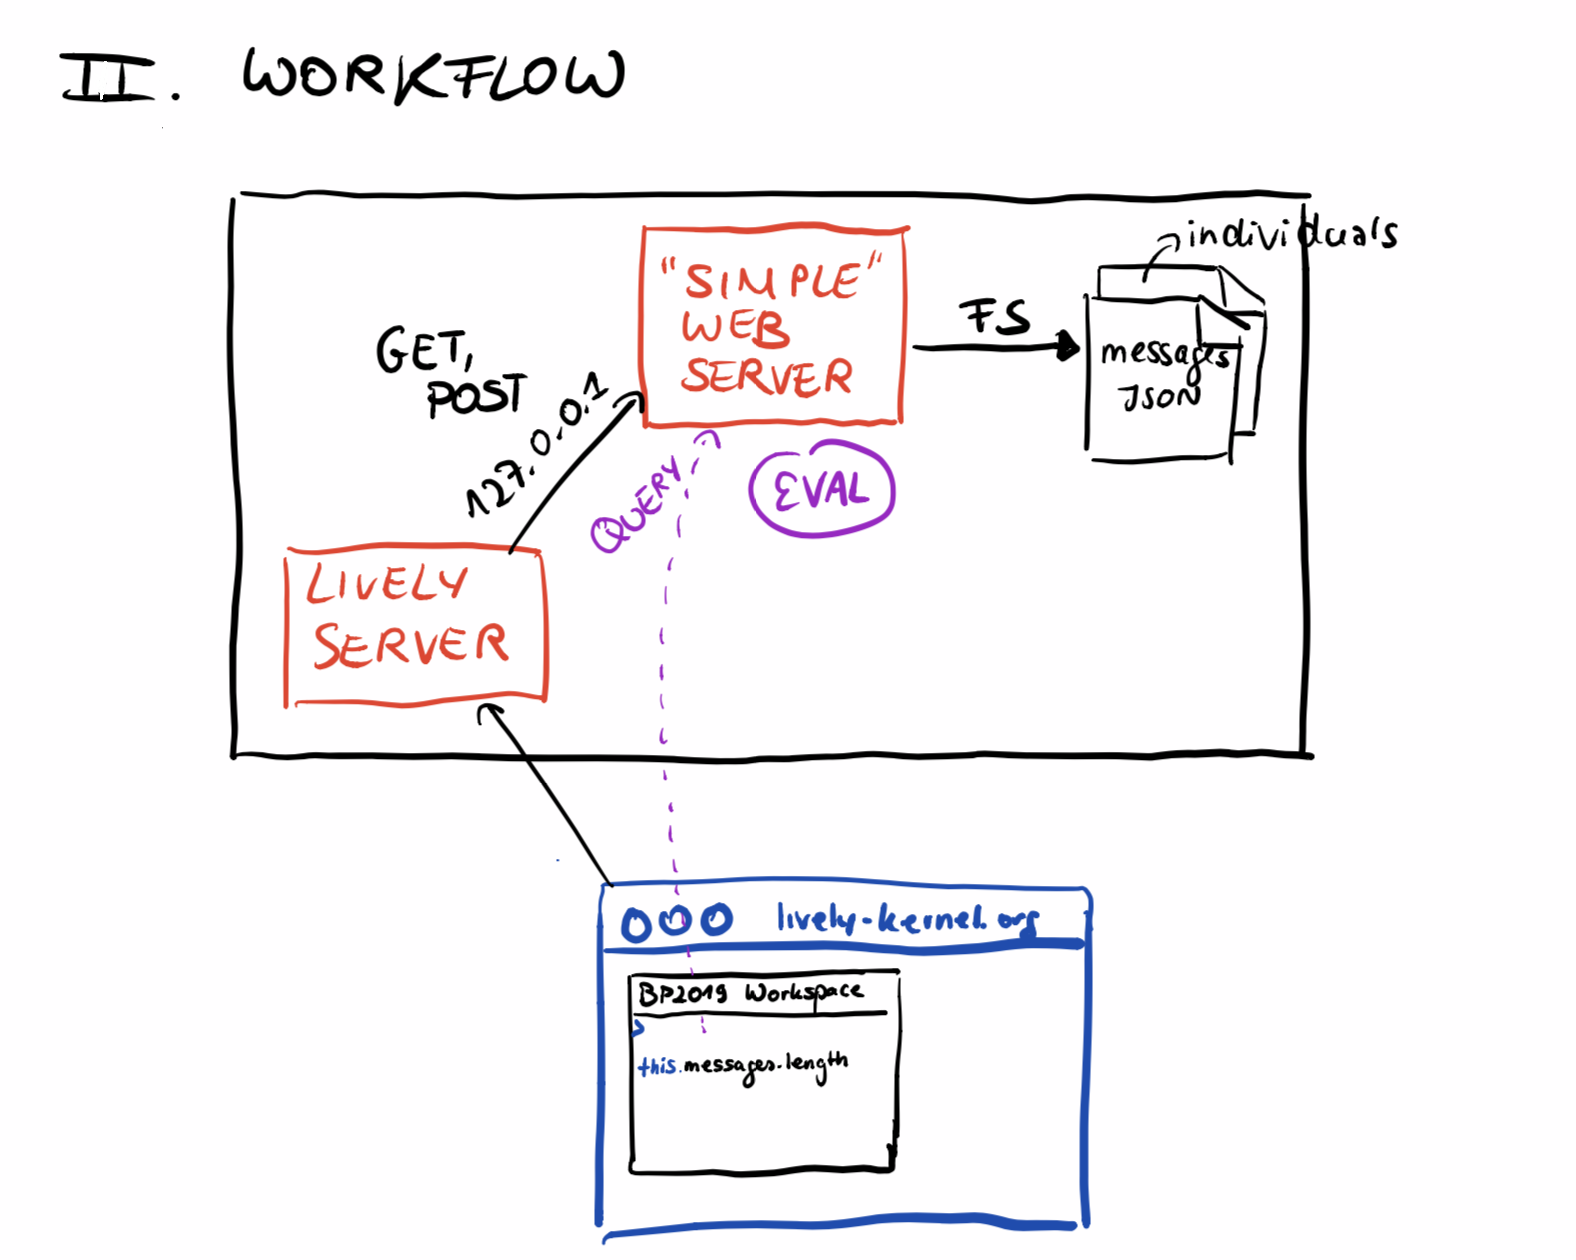{style="display: block;margin-left: auto; margin-right: auto; width: 70%;"}
---
# We have done research
### Literature/Books
The Functional Art - Alberto Cairo (Leo)
The Truthful Art - Alberto Cairo (Wanda)
- "Getting the information as right as possible comes first"
- "Show a summary first, but also let people explore as many layers of depth and breadth as is appropriate"
A Small Matter Of Programming - Bonnie A. Nardi (Simon, Moe)
Factfulness - Hans Rosling
---
# We have done research
### Literature/Books
The Design of everyday Things - Donald A. Norman (Luc)
Information is Beautiful - David McCandless (Lara)
Unflattening - Nick Sousanis (Lara)
Things come apart - Todd McLellan (Lara)
---
# We have done research
### Papers
The Gamma: Programming tools for open data-driven storytelling
- Treating data visualizations as scripts, as reproducible programs
- Offering methods to construct query which will produce visualization
The Practices of Programming - Ilias Bergström, Alan F. Blackwell
Herding Cats: Observing Live Coding in the Wild - Thor Magnusson
Incremental Relational Lenses - Rudi Horn, Roly Perera, James Cheney
Exploratory and Live, Progamming and Coding - SWA Lehrstuhl
---
# We have a couple of ideas
- Sketch ideas for diagrams
- **Design Thinking** workshop to get new ideas, creative session
- Collect a list of "parameters"
- Elements to use in visualizations
- Interactions
- Get more **input**, more interesting books or papers
---
# What we thought our goals were going to be
### Africa's Voices Researcher
Goal => Help to ease their process
1. Generate diagrams automatically.
2. Generate explorable diagrams.
3. Generate explorable diagrams to answer emerging questions.
### Africa's Voices Policy maker
Goal => Provide valuable information for decision making
{ style="float:right" alt="drawing" width="280"}
1. Build a tool to show data to policy makers.
2. Explore with policy maker / let policy maker explore.
3. Answer questions that emerge during exploration.
---
# What we think our goals are going to be now
0. **Understand** provided data / domain
1. **Brainstorm** / Design visualizations (a lot of them)
- Unconventional
- Explorable
- Individual-centered
- No completeness of data
2. **Implement** the best ideas
(3. Synthesize similarities into a framework)
---
# We have data
- Data privacy agreement
- Two files in JSON format
- Messages (1.2 GB)
- Individuals (1 GB)
- Each line in data files represents an individual/message => provenance
- Nested structure to show merge with other tracedata
- Objects contain:
- raw data (responses and personal information)
- coding of responses
- processing metadata
---
# We are working on workflows
{style="display: block;margin-left: auto; margin-right: auto; width: 75%;"}
---
# We are working on workflows
{style="display: block;margin-left: auto; margin-right: auto; width: 70%;"}
---
# We have done research
### Literature/Books
The Functional Art - Alberto Cairo (Leo)
The Truthful Art - Alberto Cairo (Wanda)
- "Getting the information as right as possible comes first"
- "Show a summary first, but also let people explore as many layers of depth and breadth as is appropriate"
A Small Matter Of Programming - Bonnie A. Nardi (Simon, Moe)
Factfulness - Hans Rosling
---
# We have done research
### Literature/Books
The Design of everyday Things - Donald A. Norman (Luc)
Information is Beautiful - David McCandless (Lara)
Unflattening - Nick Sousanis (Lara)
Things come apart - Todd McLellan (Lara)
---
# We have done research
### Papers
The Gamma: Programming tools for open data-driven storytelling
- Treating data visualizations as scripts, as reproducible programs
- Offering methods to construct query which will produce visualization
The Practices of Programming - Ilias Bergström, Alan F. Blackwell
Herding Cats: Observing Live Coding in the Wild - Thor Magnusson
Incremental Relational Lenses - Rudi Horn, Roly Perera, James Cheney
Exploratory and Live, Progamming and Coding - SWA Lehrstuhl
---
# We have a couple of ideas
- Sketch ideas for diagrams
- **Design Thinking** workshop to get new ideas, creative session
- Collect a list of "parameters"
- Elements to use in visualizations
- Interactions
- Get more **input**, more interesting books or papers