# Coming to an end
We have until the end of July.
But there are now more aspects that are part of our bachelor project:
- PR: poster, press release (28.06.)
- Final presentation (09.07.)
- Bachelor theses (22.07.)
=> Around 4 to 5 weeks time to work on the project, but it is difficult to estimate as most of these tasks are new for us
---
# 1. Keep on going as before
### Option A:
Keep improving All-in-One with remaining feedback
### Option B:
Spike new prototypes
### Option B.2:
Build in standard visualizations like (stacked/multidimensional) bar charts, sankey diagram, bundle view
---
# 2. Pick up some old ideas and try something new
### Option C:
Build a window architecture (going back to the pane prototype) to use visualizations independently of each other but with shared state
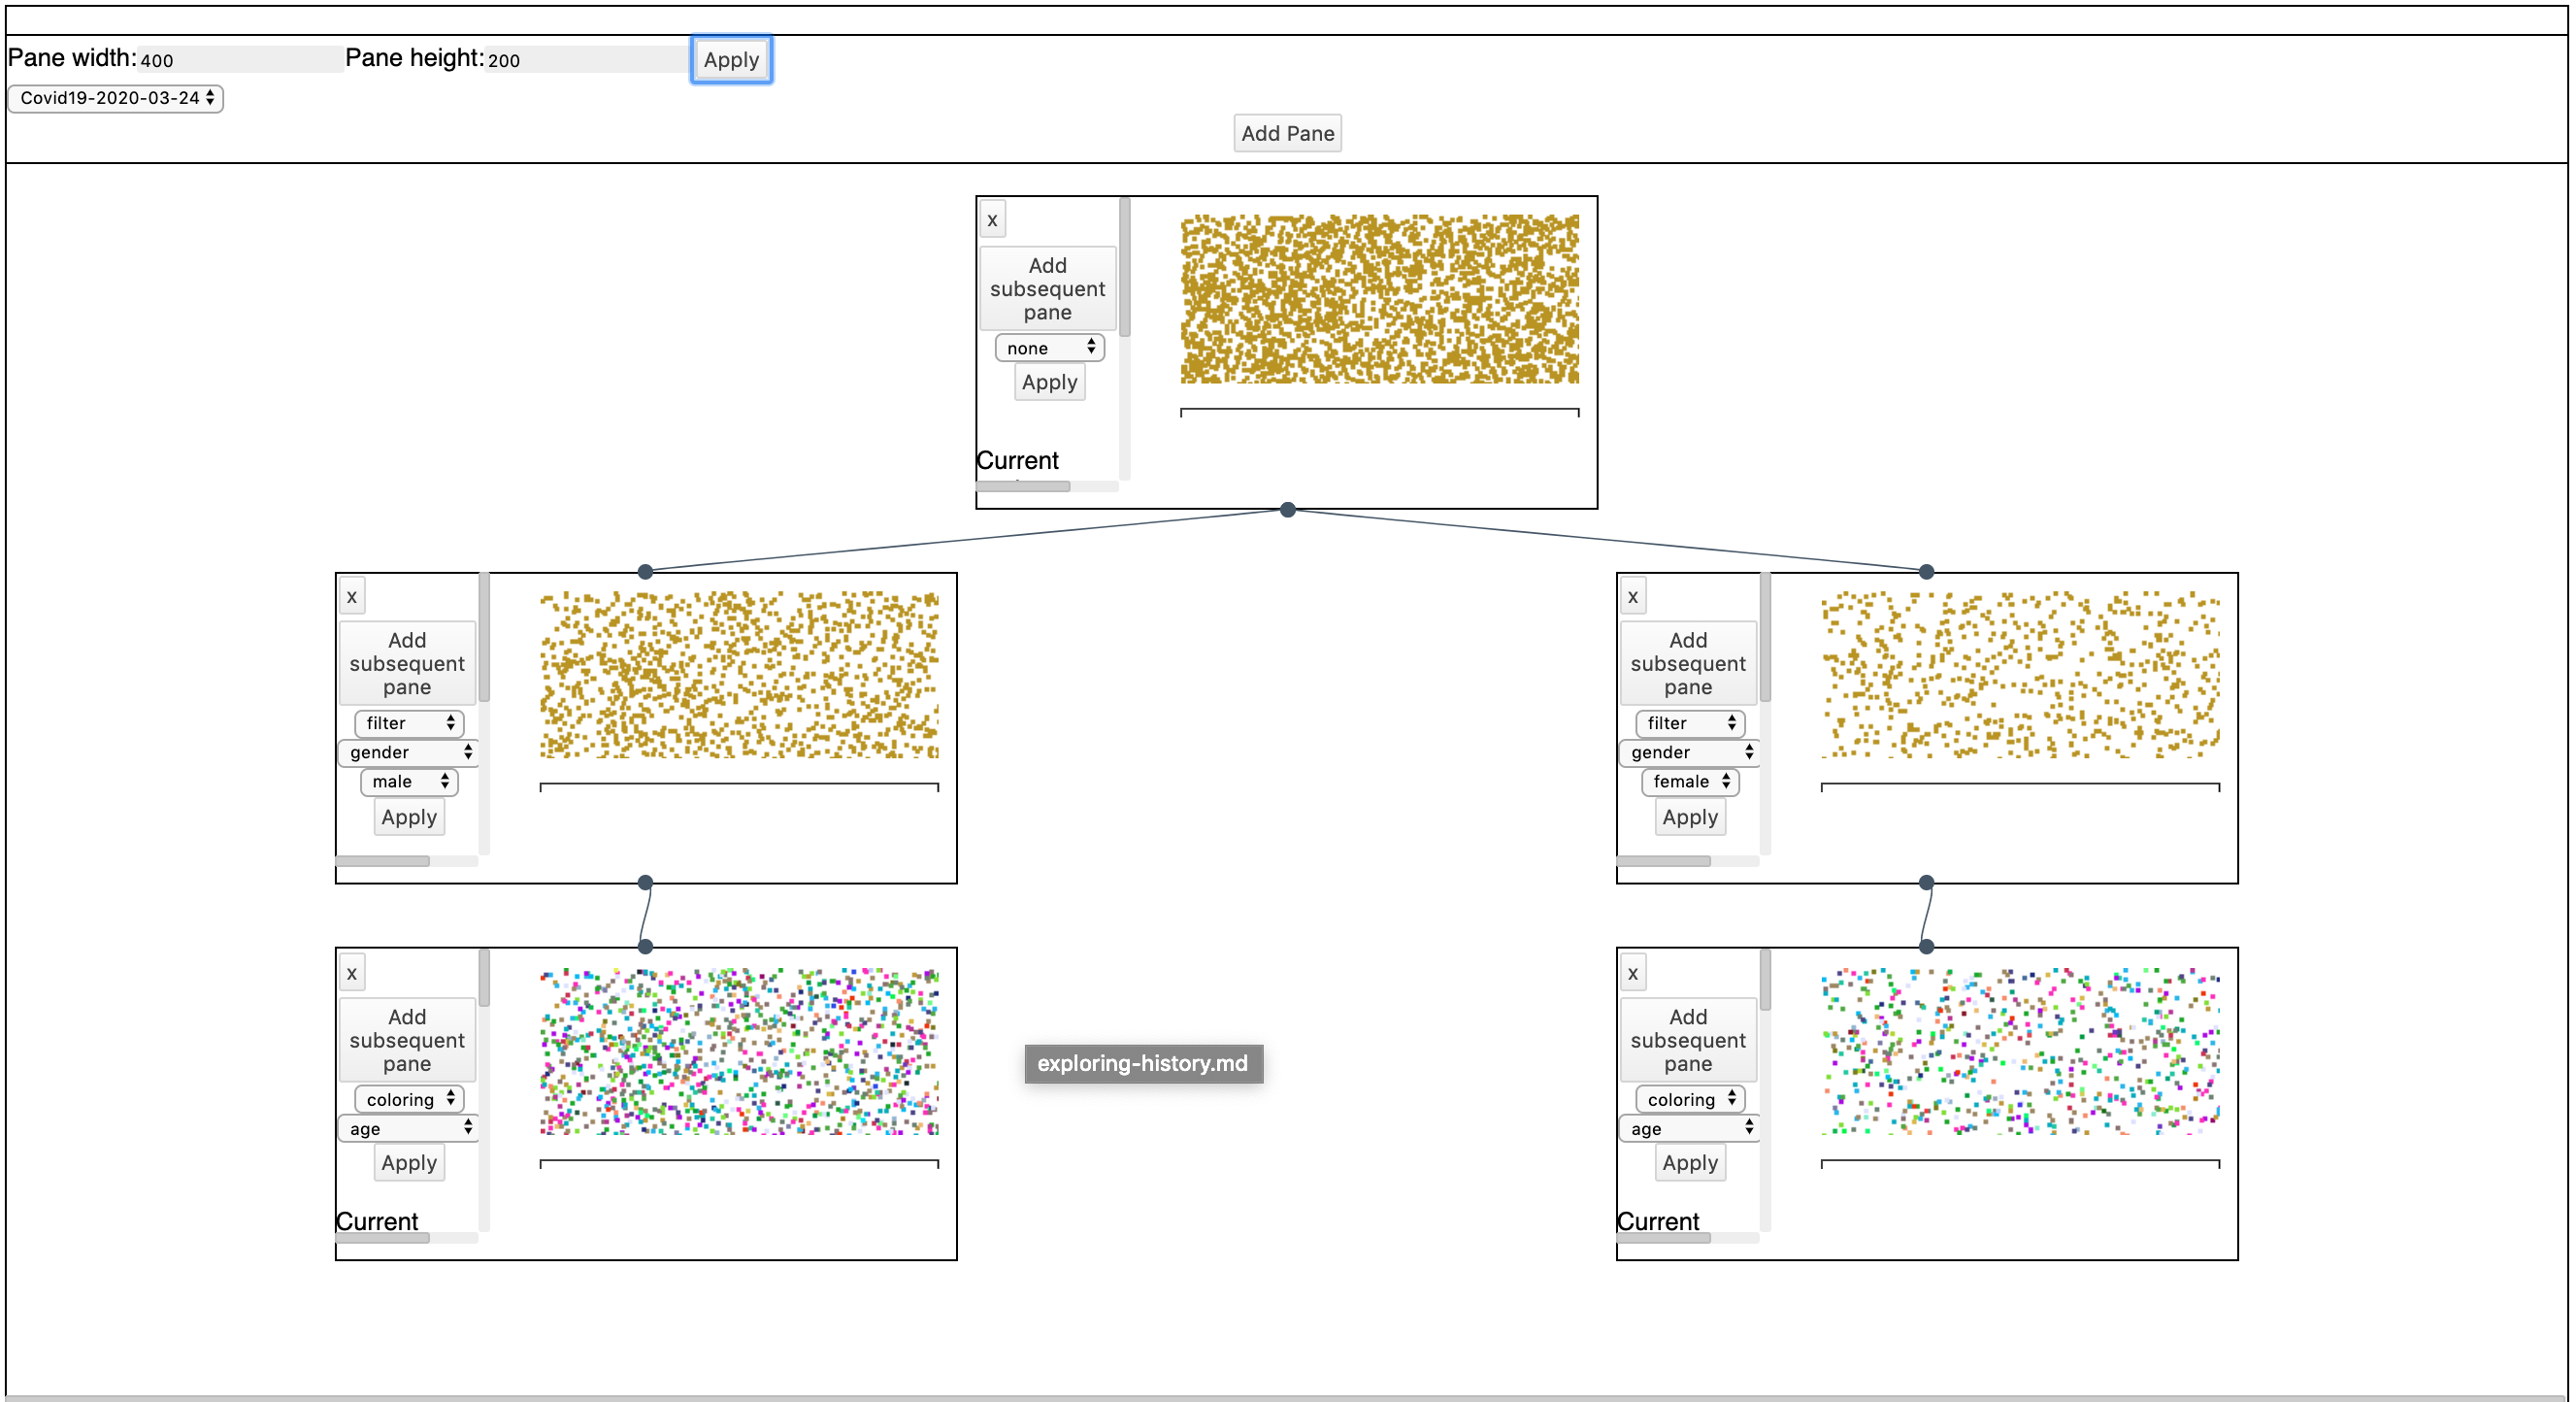{height="260", style="float:right"}
### Option D:
Work on a solution to keep state persistent
### Option E:
Improve stability and loading time of All-in-One (and everything component based)
### Option F:
Work on a solution for you to input your own data
---
# Explaining Option B: Ideas for new prototypes
- Sankey diagram
- 3D graph that connects individuals to themes
- Experiment with fake messages
- [Mindmap storyboard](https://lively-kernel.org/lively4/BP2019RH1/doc/visualizations/storyboards/mindmap.md)
- Bar charts
Interactions:
- Highlight similar individuals
- Lasso selection / filtering