PX 2018: Graph Drawing
Siegfried Horschig, Theresa Zobel
Software Architecture Group
Hasso Plattner Institute
University of Potsdam, Germany
---
# Motivation
-
Traditional and powerful tools that visually represent sets of data and the relations
among them
-
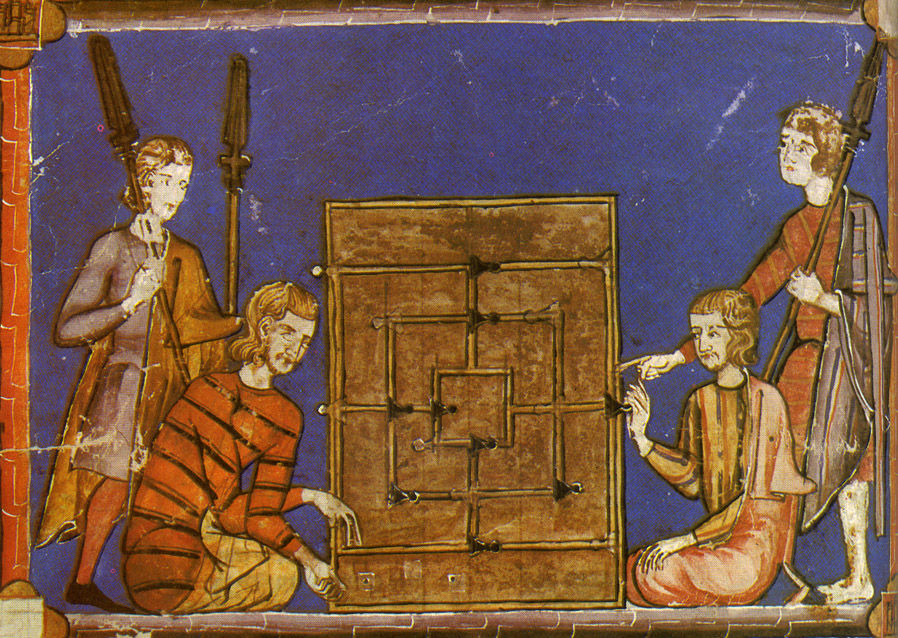
Concept of graphs can be traced back to Ancient Egypt - Game Morris
-
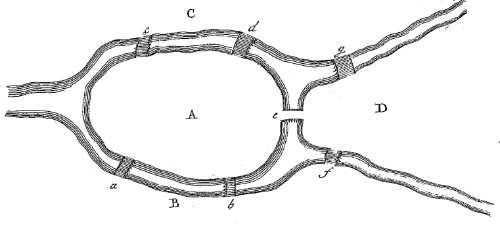
First scientific purposes 1736: Euler published his famous Königsberg paper ("drawing")
-
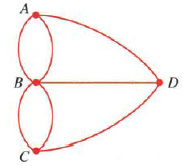
Very first abstract graph drawing appeared in Ball’s book on mathematical recreations 1892
sources:
http://stewartmath.com/dp_fops_samples/fops6.html
https://www.researchgate.net/figure/The-Seven-Bridges-of-Koenigsberg-problem-a-Eulers-drawing-31-b-Balls-abstract_fig1_325794369
http://www.instructables.com/id/Nine-Mens-Morris/
---
# Key Challenges
-
Algorithm complexity: graph size is crucial to algorithms
-
Display clutter: when size of data grows, the corresponding graph becomes cluttered and visually confusing
-
Navigation: navigating large information spaces on small displays
-
→ Readability
---
# Key Requirements
Improving readability through:
- Low number of crossing
- Small bounding box of graph
- Short edges

→
---
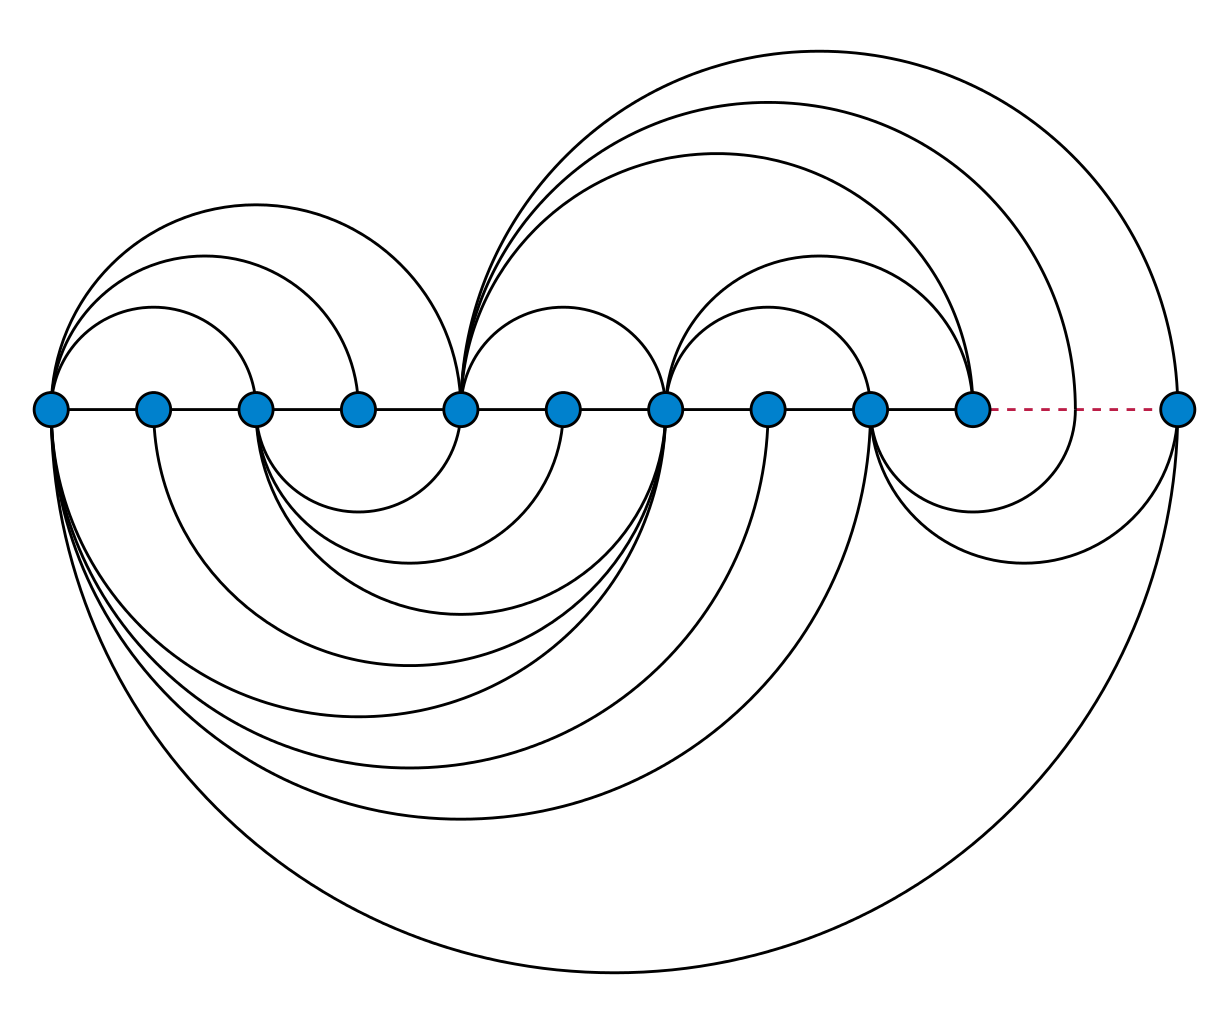
# Layout Methods
- Arc Layout: vertices of a graph are placed along a line & minimizes the number of crossings.
- Circle Layout: places the vertices of a graph on a circle (network topologies)
- Force-directed Layout
- Energy-minimizing simulations (Simulated Annealing)
source
commons.wikimedia.org
---
Force-directed Graphs
---
# General
Position the nodes of a graph in two-dimensional so that:
-
all the edges are of more or less equal length
-
few crossing edges
-
by assigning forces among the set of edges and the set of nodes and using these forces to simulate the motion of the edges and nodes
First Pioneers:
-
Eades 1984: Combination of attractive forces on adjacent vertices, and repulsive forces on all vertices
-
Fruchterman & Reingold 1991
---
# Algorithm
Dwyer's Implementation:
-
Much faster and scalable to much larger force-directed graphs: O(nlogn+m+c)
- Providing users with interactive control
over the layout
-
Allowing users to achieve layout customized for their specific
application or diagram.
- Implements three primary forces upon the nodes
source:
http://vis.stanford.edu/files/2011-D3-InfoVis.pdf
http://users.monash.edu/~tdwyer/Dwyer2009FastConstraints.pdf
---
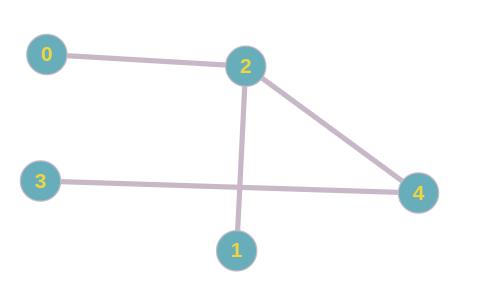
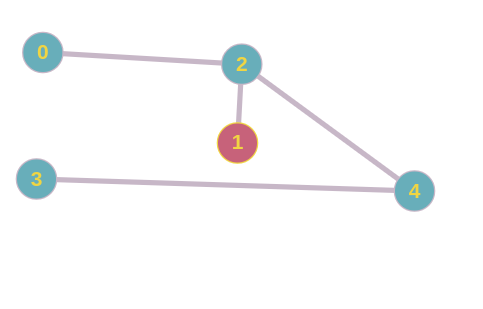
# Demo
---
# Evaluation
Advantages:
- Good quality
- Readability
- Interactivity
- Simplicity
- Bounding Boxed
Disadvantages:
- Can lead to jittering
- Possible high running time
- Not very stable
---
Simulated Annealing
---
# Simulated Annealing

Source: homesteading.com
---
# General
* Attempts to find global optimum
* Energy function to determine fitness of solutions
* "Annealing" Principle:
* Initial high "Temperature" value, decreasing with time
* Alters solution (switches to neighbouring solution) if:
* Neighbouring solution has a lower energy or
* Neighbouring solution has a higher energy and the temperature is high
---
# Implementation
* Inspired by d3-labeler
* Definition of "neighbouring solution" per iteration:
* Movement of all nodes?
* Takes longer, but may lead to faster convergence
* Movement of one node?
* May need more iterations for good result
* Better for demonstration purposes
---
# Implementation
→
### Accept if:
Energy(new) < Energy(old)
or
Math.random() >= Math.exp(-delta_energy / currentTemperature)
---
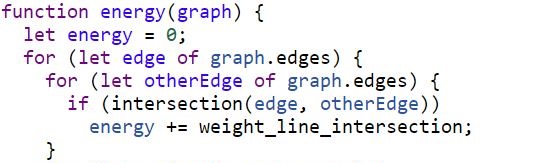
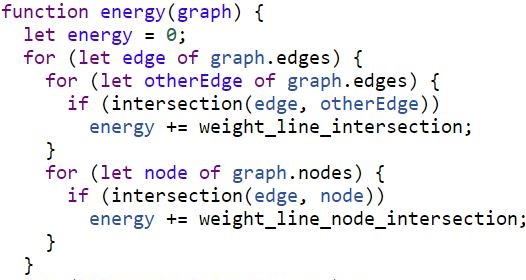
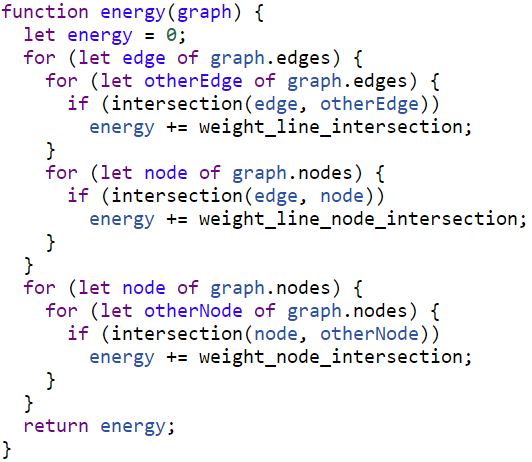
# Energy Function (Example)
---
# Energy Function (Example)
---
# Energy Function (Example)
---
# Demo
---
# Evaluation
### Advantages:
+ Can stop after any amount of iterations
+ Custom criteria are easy to implement and extend
### Disadvantages:
- High runtime (O(n4))
- Less applicable for larger graphs
---
Force-Layout Graph vs Simulated Annealing
---
# Demo
---
# Conclusion
* Simulated Annealing easily customizable, but less applicable for large graphs
* Force layout provides widely applicable, reasonably fast and interactive solution
 ---
# References
* Cui, Weiwei, and Huamin Qu. "A survey on graph visualization." PhD Qualifying Exam (PQE) Report, Computer Science Department, Hong Kong University of Science and Technology, Kowloon, Hong Kong (2007).
* Bostock, Michael, Vadim Ogievetsky, and Jeffrey Heer. "D³ data-driven documents." IEEE Transactions on Visualization & Computer Graphics 12 (2011): 2301-2309.
* Dwyer, Tim. "Scalable, versatile and simple constrained graph layout." Computer Graphics Forum. Vol. 28. No. 3. Oxford, UK: Blackwell Publishing Ltd, 2009.
* Gibson, Helen, Joe Faith, and Paul Vickers. "A survey of two-dimensional graph layout techniques for information visualisation." Information visualization 12.3-4 (2013): 324-357.
* Hadany, Ronny, and David Harel. "A multi-scale algorithm for drawing graphs nicely." International Workshop on Graph-Theoretic Concepts in Computer Science. Springer, Berlin, Heidelberg, 1999.
---
# References
* Cui, Weiwei, and Huamin Qu. "A survey on graph visualization." PhD Qualifying Exam (PQE) Report, Computer Science Department, Hong Kong University of Science and Technology, Kowloon, Hong Kong (2007).
* Bostock, Michael, Vadim Ogievetsky, and Jeffrey Heer. "D³ data-driven documents." IEEE Transactions on Visualization & Computer Graphics 12 (2011): 2301-2309.
* Dwyer, Tim. "Scalable, versatile and simple constrained graph layout." Computer Graphics Forum. Vol. 28. No. 3. Oxford, UK: Blackwell Publishing Ltd, 2009.
* Gibson, Helen, Joe Faith, and Paul Vickers. "A survey of two-dimensional graph layout techniques for information visualisation." Information visualization 12.3-4 (2013): 324-357.
* Hadany, Ronny, and David Harel. "A multi-scale algorithm for drawing graphs nicely." International Workshop on Graph-Theoretic Concepts in Computer Science. Springer, Berlin, Heidelberg, 1999.